Complete the table of ordered pairs for
the equation \(y = x^2 − 2\).
To complete the table of ordered pairs for the equation \(y = x^2 − 2\), we substitute each \(x\)-value
into the equation to obtain the corresponding \(y\)-value:
Substituting \(x = -3\) into the equation \(y = x^2 − 2\), we get \(y = (-3)^2 − 2 = 7\).
This is the point \((-3; 7)\).
Substituting \(x = -2\) into the equation \(y = x^2 − 2\), we get \(y = (-2)^2 − 2 = 2\).
This is the point \((-2; 2)\).
Substituting \(x = -1\) into the equation \(y = x^2 − 2\), we get \(y = (-1)^2 − 2 = -1\).
This is the point \((-1; -1)\).
Substituting \(x = 0\) into the equation \(y = x^2 − 2\), we get \(y = (0)^2 − 2 = -2\).
This is the point \((0; -2)\).
Substituting \(x = 1\) into the equation \(y = x^2 − 2\), we get \(y = (1)^2 − 2 = -1\).
This is the point \((1; -1)\).
Substituting \(x = 2\) into the equation \(y = x^2 − 2\), we get \(y = (2)^2 − 2 = 2\).
This is the point \((2; 2)\).
Substituting \(x = 3\) into the equation \(y = x^2 − 2\), we get \(y = (3)^2 − 2 = 7\).
This is the point \((3; 7)\).
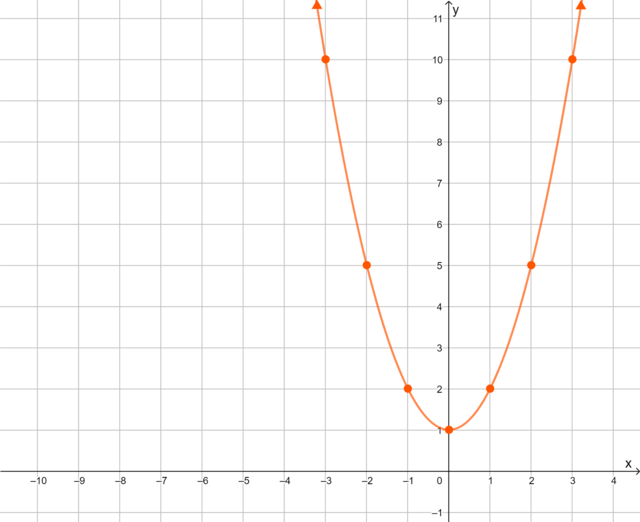
Plot the points on the Cartesian plane
and draw the graph.
From the table of values, we obtain seven ordered pairs. We plot each point on the Cartesian plane and draw
the graph by joining the points with a curve.

What do you notice about this graph? Here are some keywords to help you describe some of the features of
the graph:
- turning point
- minimum
- symmetry